Beyond Store-Level Data: Finding the Right Geographic View of Retail Demand
|
By Phil Willis
Beyond Store-Level Data: Finding the Right Geographic View of Retail Demand
12:38
What is the difference between chain-level, store-level, and ZIP-code retail analytics?
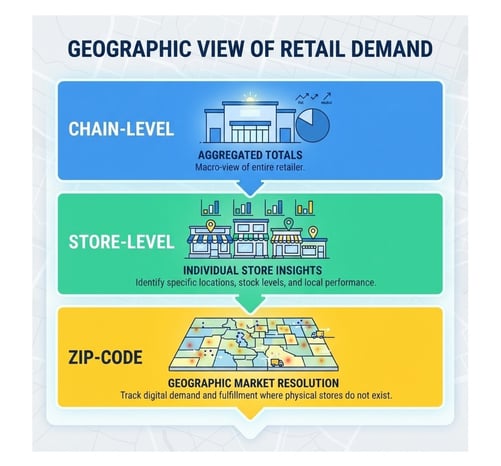
Quick Answer: Chain-level data aggregates performance into a single macro total across an entire retailer, while store-level data isolates individual physical storefronts to uncover hyper-local out-of-stocks. For digital channels, ZIP-code reporting provides location-level intelligence, allowing CPG brands to track e-commerce demand fulfillment where physical stores do not exist.
For years, consumer packaged goods (CPG) manufacturers have relied heavily on point-of-sale (POS) data to understand demand, manage inventory, and collaborate with retail partners. However, the business utility of that data depends entirely on a singular question: At what geographic level can you actually see the business?
The real objective is not gathering granular data for its own sake. It is achieving enough geographic resolution to determine where demand is peaking, where opportunities are being dropped, and exactly where operational action should be taken.
The Core Trade-Offs in Retail Geography
|
Geographic Level |
Primary Analytical Use |
Key Limitations |
|
Chain-Level |
Account summaries, broad trend lines, executive reporting, macro retailer comparisons. |
Aggregation traps; local spikes and product out-of-stocks are flattened into meaningless averages. |
|
Store-Level |
Localized assortment, out-of-stock mitigation, field team routing, promotion lift validation. |
Requires constant metadata updates (GLNs, store IDs) and clean master data mapping. |
|
Geographic Market (ZIP) |
Digital/E-commerce fulfillment tracking, regional market testing, boundary-free demand mapping. |
Requires translation layers; ZIP codes are fulfillment pathways, not static physical shelves. |
Chain-Level Data Provides the Score, But Not the Explanation
Chain-level data remains structurally useful for broad indexing. Its primary failure point, however, is aggregation. A consumer goods brand can easily look at a dashboard showing stable, healthy chain-wide sales while completely missing major systemic leaks beneath the surface.
A single corporate total masking localized operational flaws often hides the following issues:
- Certain high-growth markets are carrying collapsing regional territories.
- Products are completely unavailable across a highly meaningful cluster of stores.
- A major trade promotion is highly successful in one region but failing completely in another.
- Distribution footprints are expanding in some zones while actively contracting in others.
- Safety stock exists inside the retailer’s distribution center network but not on the shelves where consumers are actively trying to buy it.
Once these operational variations are rolled into a single grand total, local crises and unique opportunities simply become averages.
Store-Level Data Makes Retail Performance Actionable
For brick-and-mortar brands, granular analysis begins with an underlying structural prerequisite: your source data must map to a unique identifier for each store location. Depending on the retailer's IT landscape, this could be an internal store number, a location code, or a Global Location Number (GLN).
Once chaotic retail files are cleanly parsed and mapped to individual storefront identifiers, analytics teams can answer highly targeted commercial questions:
- Which precise retail doors are driving our categorical growth?
- Which specific stores are failing to carry an authorized SKU?
- Where exactly are phantom inventory and out-of-stocks destroying our daily sales velocity?
- Which regional markets yield the highest lift during active promotions?
- Where should field-sales representatives be prioritized tomorrow morning?
This shifts POS data out of the historical archive. Instead of working as a trailing scorecard, harmonized store data becomes an active operational pipeline for replenishment, predictive forecasting, and near real-time retail execution.
Traditional Shipments ---> Show product moving into a retail warehouse network.
Store-Level POS Data ---> Shows what consumers actually purchased at the shelf.
Store-Level Visibility in an Omnichannel World
While e-commerce platforms continue to capture market share, the physical shelf remains the foundation of retail commerce. According to the U.S. Census Bureau, e-commerce accounted for 17.1% of total U.S. retail sales in Q2 2026, meaning the overwhelming majority of consumer transactions still take place inside physical retail structures.
Concurrently, modern paths to purchase have become entirely fragmented and omni-channel. McKinsey reports that today's consumer journeys routinely cross multiple digital and physical boundaries. A shopper may discover a product on social media, research its components on a mobile device, check regional availability online, and complete the final purchase at a local retailer.
For modern brands, national data views are blinding. A high-level sales figure can indicate macro growth, but it cannot reveal whether that growth is distributed evenly across thousands of doors or isolated within a single regional pocket. Truly understanding where items sell and where inventory sits is the only path to clean category management.
Trade Promotions: The Danger of Aggregation
Trade promotions represent another massive financial investment where aggregate chain-level data obscures performance gaps. A promotional campaign might look like a sweeping success when measured across a retailer’s national footprint, yet a store-by-store audit often reveals extreme volatility.
With clean, store-level POS and harmonized location metadata, analytics teams can accurately isolate promotional lift by individual store, city, market, or territory. This clarity helps commercial teams distinguish an genuinely successful campaign from an irregular spike driven by a tiny handful of outlier locations.
This granular observability is essential for validating store execution. A campaign can be brilliantly designed at corporate headquarters, but its absolute ROI depends on in-store compliance: product availability, accurate promotional pricing, display placement, and localized merchandising. Industry research from organizations like Repsly indicates that poor retail execution can drain up to 25% of potential retail sales, proving how expensive the gap between corporate planning and store execution can be.
Granular Transactions Require Location Metadata
Isolating a raw store number is merely step one. To convert store-level activity into true geographic intelligence, your pipeline must enrich those transactions with descriptive location metadata, including:
- Full Address details
- City, State, Province, and Country tags
- Internal operational sales territories or custom regional boundaries
- Store type and format classifications
Without this automated enrichment, a data lake might track that an event happened at "Store 1234," but business users will remain completely unable to group that transaction into a coherent regional market or territory view. Granular transactional activity identifies the location; rich metadata makes that location meaningful.
What Happens When a Retailer Has No Stores?
The conventional store-level architecture changes significantly when assessing digital marketplaces. Amazon, for example, operates without a standard physical network of storefronts tied to its online POS reports. Yet, geographic demand variation remains distinct.
CPG brands selling on digital platforms still need to map:
- Where specific consumer cohorts are purchasing products
- Which distinct geographic territories are accelerating
- How core demand signals shift across different climates and zones
This is where ZIP-code-based reporting patches the visibility gap. Amazon reporting can deliver shipped sales and revenue data grouped by ZIP geography. This gives brands the ability to organize digital commerce geographically while maintaining their overarching chain view. Instead of asking, "Which store sold this unit?" the question pivots to: "Where is consumer demand being fulfilled?"
Analytically, ZIP regions must not be treated exactly like physical doors, but they provide the exact geographic dimension required to move beyond a blind, nationwide e-commerce total. It expands traditional store-level reporting into modern location-level analytics.
The Four Questions For an Actionable Data Strategy
More granular data is not automatically better data; it is simply noisier data if your pipelines are unprepared. Before scaling your geographic reporting, ensure your retail data architecture can cleanly answer four operational questions:
- Does the source provide a reliable, unique location identifier? (The foundation for matching raw transactions to physical reality).
- Is the supporting location metadata complete? (Ensuring a store number is automatically enriched with city, state, and custom sales territory attributes).
- Is your location information kept current? (Automating pipelines so your reports immediately adapt to a retailer's opening, closing, or relocating storefronts).
- Can granular sales data be cleanly reconciled with the macro retailer view? (Ensuring that your deep location-level drills perfectly match your top-line corporate financial records without data discrepancies).
The Bottom Line
The future of retail analytics isn't about collecting massive volumes of unmapped data—it is about establishing immediate, useful context. Chain-level reporting tells you how your retail business performed; location-level analytics explains exactly where that performance was generated and where your next market opportunity is hidden.
👉 Contact us today for more information on how to align your data strategy with actionable consumer demand.
Frequently Asked Questions About Retail Geography
Why do traditional chain-level reports mask drops in retail sales velocity?
Chain-level reporting suffers from aggregation bias. Because it rolls all performance metrics into a single account total, local problems and opportunities are flattened into misleading averages. For example, exceptional sales growth in a single major metropolitan market can artificially mask severe product out-of-stocks, failed trade promotions, or contracting distribution footprints in an adjacent regional sales territory.
What master data is required to turn raw store-level retail data into actionable geography?
Isolating a basic storefront number is only the first step. To build meaningful geographic intelligence, your retail data pipeline must automatically enrich raw transactional strings with descriptive location metadata. This includes matching unique storefront identifiers (like Global Location Numbers or store codes) to static location attributes such as full address, city, state, province, country, format type, and your brand's custom internal sales territory boundaries.
How do CPG brands track location-level retail demand on e-commerce channels with no physical stores?
When a digital marketplace like Amazon does not utilize a conventional network of storefronts, brands shift their analysis from physical coordinates to fulfillment pathways. By leveraging Amazon's reporting of shipped sales and revenue by ZIP geography, manufacturers can group digital transactions into distinct geographic demand markets. This transforms traditional store-level tracking into location-level analytics, answering where consumer demand is actually being fulfilled.
How often should a retail data platform's location information be refreshed?
Location data must be refreshed consistently and automatically to remain accurate. Retailer networks are highly dynamic—new brick-and-mortar stores routinely open, underperforming locations close or relocate, and regional sales territories are frequently reorganized. Keeping these data pipelines constantly updated ensures that incoming granular transactions always map cleanly to current, useful geographic attributes.